
P-DisΔ: where the return rate really deviates
Deviations weighted by size – and a look at the stages that come next.
Which channel sells which range better than average? And is that big enough to bother with? Questions like these aren’t asked once but every month. Until now that meant every time: build a report, check the numbers, explain the result. Pythia turns it into a toolkit.
Two ingredients, one recipe
P-DisΔ works like a baking mix where you only add two eggs. You choose two ingredients – say channel and range, or return rate and quality – and Pythia supplies the matching analysis recipe: which method applies, what is compared, how the result should be read.
Three methods sit behind it:
- Relative index: which combination is above or below what its marginal totals would lead you to expect? Does a channel sell a range more strongly than its overall share would suggest?
- Signal response: how does a range respond to shopping weather?
- Rate comparison: where does the return rate deviate – by channel, range, product group, item or quality?
Size before percentages
Every result line is a sentence, and that sentence starts with the size: small, medium or large. It also carries a confidence level – observation, relationship or confirmed direction. The word “causal” does not appear.
A high rate in a tiny cell is striking but unimportant. P-DisΔ puts small cells at the end and sorts rates by the excess amount in euros.
That way the number that stands out most loses its false importance, and the one that really costs money moves to the top.
Repeat, record, pass on
Every result can be checked, put in context with last year and saved as a snapshot – with data state and rule version, so that a year from now you still know what it was based on. Export is available as JSON and as a CSV that opens straight into a spreadsheet.
What comes next
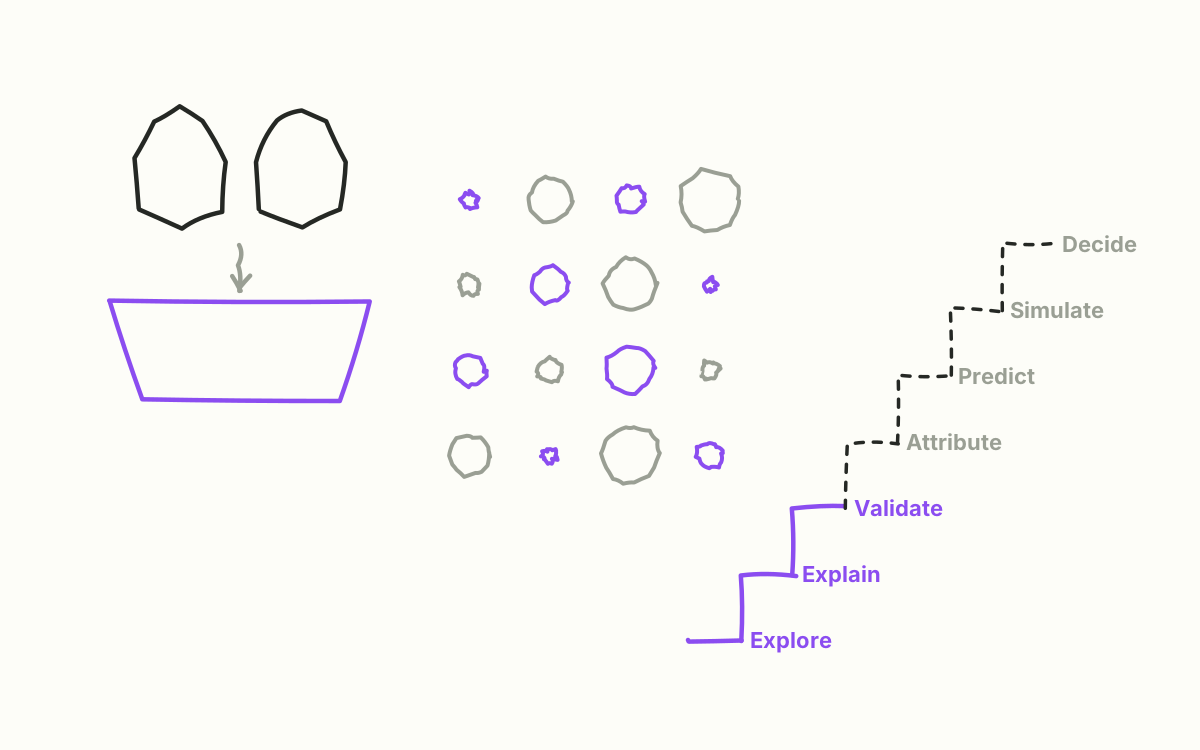
Today Pythia stands firmly on the first three stages: what happened, why – and would the forecast have been right? The third stage, Validate, checks exactly that: what would Pythia have predicted back then – with what was known then, not with what we know today? The next stages are planned and described:
- Attribute: estimated contributions of weather, promotion and price to a jump in sales, explicitly as an estimate.
- Predict: a timeline that reaches into the future with a corridor and knows planned promotions as assumptions.
- Simulate: scenarios side by side, calculated through to revenue, contribution margin and stock.
- Decide: a purchasing proposal with its reasoning and the risk of buying too little or too much.
The groundwork is laid: complete data, an expectation that explains itself, a signal store that knows what was known when, and rules you can look up. Pythia’s story continues – and so does this blog.